


New Relic's 2025 Observability Forecast for Retail and eCommerce put the median cost of a critical retail outage at $1 million per hour. Nearly one in three retailers gets hit by a high-impact outage every week. The median time to even detect it? Thirty minutes. By then, you've already lost revenue you will never recover.
Magento stores have their own specific failure patterns. A cron job stops running, and for two days, no one notices because the symptoms show up in weird places: email confirmations stop, price rules don't apply, catalog changes don't propagate. A developer disables full page cache to debug a layout issue, forgets to re-enable it, and your store starts hitting the database on every page load. A PHP memory limit that was fine six months ago is now too low because you added four extensions. None of these is mysterious. All of them are detectable before a customer calls.
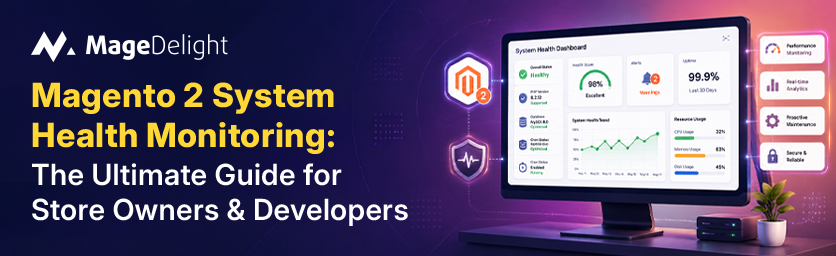
This guide covers the full picture: what to monitor in Magento 2, why each component fails, how to build a monitoring routine that actually gets used, and where MageDelight's AI Magento Health Monitor Dashboard fits into that. Whether you're a store owner who wants to stay informed without needing CLI access or a developer who maintains several Magento installs and is tired of finding out about problems from clients, this is the same page.
Downtime Is a Revenue Problem. Magento Makes It a Configuration Problem.
Store owners tend to treat infrastructure monitoring as something the developers handle. That makes sense until it doesn't. The categories of issues that cause the most Magento downtime aren't server failures or cloud provider outages. There are things like a misconfigured cron schedule, an indexer stuck in real-time mode on a 200,000-SKU catalog, or a cache type disabled three weeks ago and never turned back on.
ITIC's 2024 survey found that over 90% of mid-size and large enterprises lose more than $300,000 per hour during unplanned downtime. The Uptime Institute's 2024 Annual Outage Analysis found that 53% of all outages trace back to IT and network misconfiguration, and that the majority of severe outages were rated preventable. Not 'could be improved with better processes.' Preventable.
The word preventable is doing a lot of work there. It means someone could have seen the warning signs before the outage. The issue isn't that Magento is fragile. It's that most stores don't have a structured routine for checking the things that go wrong before they go visibly wrong.
The Seven Components That Break Magento Stores
Magento's subsystems are tightly coupled. When cron stops, indexers fall behind. When indexers fall behind, the cache becomes stale. When the cache is stale, the database load spikes. One failure rarely stays contained. Here's what each layer does, how it fails, and what the store-level symptom looks like.
1. Cron Jobs
Magento's cron system is the engine behind most of its background work. Adobe's official cron documentation lists what depends on it: order processing, scheduled indexing, email notifications, customer segment updates, catalog price rule application, and newsletter sending. When cron stops, all of these stop. The problem is they stop quietly.
There are three failure states to be aware of. A job with an ERROR status ran but threw an exception. A job with MISSED status was scheduled but never started, usually because a previous job locked the cron process for too long. And then there's the case where the cron process itself isn't running at all, which means nothing in that list above runs, regardless of the schedule.
Errors and missed jobs get logged in the cron_schedule database table and in var/log/exception.log. But unless someone checks those logs on a schedule, a broken cron can sit unnoticed for days while order confirmation emails pile up in a queue that's going nowhere.
Also read: How to Configure Magento 2 Cron Job Guide?
2. Cache Types
Magento runs more than a dozen cache types. Adobe's cache management documentation covers the full list: configuration, layout, block HTML, collections, full page cache, translation, and several others. Each one offloads specific work from PHP and the database. Disable any of them, and that work will be recalculated on every request.
Full page cache (FPC) is the one that matters most for performance. With FPC on and Varnish configured, most page requests bypass PHP entirely. Without FPC, every product page, category page, and CMS page hits the full Magento stack. Target cache hit rates should be at least 80%. Below that, something is misconfigured, or a block is being flagged as non-cacheable.
The most common way FPC gets disabled in production is when a developer turns it off during a debugging session and doesn't turn it back on. It's not malicious, it's just a gap in the post-debug routine. The store runs without FPC; nobody notices until traffic picks up and the server starts struggling. Adobe's performance documentation recommends Varnish as the full page cache server for all production stores, with the built-in Magento FPC reserved for development only.
3. Database Health
Current Magento 2.4.8 requires MySQL 8.4 or MariaDB 11.4. MySQL 5.7 was dropped in Magento 2.4.4. If you're still running 5.7, you're outside the supported matrix, and you're accumulating security and compatibility debt. The Adobe software requirements page is the definitive reference for what's currently supported.
Beyond version, the practical database issues on active stores are: the cron_schedule table growing uncontrolled (it accumulates every scheduled job entry and can reach millions of rows on busy stores), slow queries caused by missing indexes on large catalog tables, and log tables like report_viewed_product_index that bloat over time without regular cleanup. These don't cause obvious 500 errors. They show up as intermittent slowness that's hard to trace without looking directly at query times.
4. PHP Environment
Two PHP variables account for a disproportionate share of hard-to-diagnose Magento failures: the memory limit and the PHP version.
Memory limit is the sneakier one. Magento's memory floor for a basic store is 756MB. Add several extensions, a large catalog, and bulk operations like reindexing or CSV import, and you need 2GB or more. When a process hits the limit, it doesn't always throw a visible error. It exists silently. The result looks like a hung operation, a partial import, or an indexer that 'ran' but produced nothing. Run php -i | grep memory_limit from CLI to check the actual value, then run the same check in your web server's PHP configuration. They're separate, and they need to match.
Version is the stricter constraint. Magento 2.4.8 supports PHP 8.3 and 8.4 only. PHP 8.1 and 8.2 are no longer in the supported matrix. Adobe's configuration guide also flags that PHP settings must be identical for both the CLI and web server plugin. A mismatch between the two is a known root cause of cron jobs behaving differently from the web application, which is one of the hardest bugs to reproduce and diagnose.
5. Indexer Status
Magento uses indexers to maintain prebuilt views of catalog data, such as product prices by customer group, category-product assignments, and stock status. When an indexer is invalid, what customers see is stale: wrong prices, products that shouldn't be visible, stock levels that are hours or days old. Run bin/magento indexer: status to check. Any indexer showing 'invalid' or stuck in 'processing' needs attention.
Indexers run in one of two modes. Real-time mode re-indexes on every product save, which is fine for small catalogs and painful for large ones. A store with 50,000 SKUs on real-time mode will grind the admin panel to a near halt every time a buyer purchases changes stock status across related products. Scheduled mode is much better for performance, but it requires cron to be running. If cron is broken, scheduled indexers never execute, and nothing in the index gets updated until someone notices and runs a manual reindex.
Also read: How to Manage Index and Cache Management Using Magento 2 REST API?
6. Filesystem and Disk
Magento writes constantly: session files to var/session, logs to var/log, generated code to generated/, static assets to pub/static. A full disk is an immediate hard stop. What makes disk issues especially disruptive is that var/log can fill a disk in hours during an error storm, where one uncaught exception triggers thousands of log writes per minute until there's no space left.
Permission problems are their own category. Magento has specific ownership requirements across its directory tree. A deployment that sets incorrect permissions on pub/static causes static asset generation to fail, resulting in CSS and JavaScript failing to load across the storefront. The symptom looks catastrophic. The fix is usually one chmod command.
7. Module Conflicts and Code Integrity
Magento's plugin system lets third-party extensions hook into core classes at specific interception points. When two extensions intercept the same method, things break in ways ranging from 500 errors to subtly incorrect behavior that produces incorrect output without throwing any exception.
Module conflicts happen most often right after a Composer update or after installing a new extension. The timing is the tell: 'it was working yesterday.' If a store is on a regular schedule of extension updates without any post-update integrity checks, undetected conflicts accumulate. Eventually, one of them hits something customer-facing.
Four Ways to Monitor Magento Health: What Each Actually Gets You
Before picking a monitoring approach, it's worth being honest about the tradeoffs. Cheaper options require discipline. Deeper options require expertise. Most teams end up with something in between.
|
Approach |
Setup Effort |
What You See |
Non-Dev Friendly |
Best For |
|
CLI Commands |
Low |
One component at a time, on-demand only |
No |
Developer spot-checks during incidents |
|
Magento Admin (built-in) |
None |
Cache types and indexer states only |
Partial |
Cache and indexer monitoring on small stores |
|
APM Tools (New Relic, Datadog) |
High |
Deep server-level: PHP errors, DB queries, memory |
No |
Enterprise stores with dedicated DevOps |
|
MageDelight AI Health Monitor |
Minimal |
Cron, cache, DB, PHP, indexers, modules, filesystem |
Yes |
Store owners and developers who need one admin view |
How Magento Monitoring Actually Works in Practice
Three realistic approaches, with honest limitations on each.
CLI Commands: Fast but Manual
Most Magento developers start here. These commands give you current system state in seconds:
- bin/magento cron:run
- bin/magento indexer:status
- bin/magento cache:status
- bin/magento setup:db:status
- bin/magento queue:consumers:list
The problem is not that these commands are bad. It's that they require someone to run them. If your monitoring plan depends on a developer checking things manually, it will be inconsistent when things are busy, which is exactly when issues are most likely to exist.
Built-In Admin Tools: Good Start, Real Gaps
The Magento admin panel covers the basics under System > Tools > Cache Management and System > Tools > Index Management. For a small store with one developer who checks in daily, this is often enough for cache and indexer status.
What it doesn't cover: cron job health, PHP environment details, database performance metrics, module conflict detection, or filesystem status. To get the full picture, you're bouncing between admin sections and server log files. There's no single view.
APM Tools: Deep Visibility, High Overhead
New Relic, Datadog, and Sentry provide server-level observability: slow PHP transactions, database query traces, memory usage over time, and exception rates. Adobe Commerce Cloud Pro includes New Relic by default, which is useful if you're on that tier.
The honest limitation: these tools are designed for infrastructure engineers. A store owner or even a Magento developer who isn't used to APM interfaces will find them overwhelming. Setting up meaningful alerts takes time. Interpreting the data requires context. For stores that don't have a dedicated DevOps person, APM tools often get installed, produce alerts nobody investigates, and then get treated as background noise.
MageDelight AI Magento Health Monitor Dashboard
The MageDelight AI Magento Health Monitor Dashboard sits within the Magento admin and fills the monitoring gap left by CLI commands and built-in tools. It costs $99 for the first year and $69 per year after. Free professional installation is included.
The architecture is collector-based. Each subsystem (PHP environment, database, cache, cron, filesystem, modules) has its own independent collector. When one collector is updated or changed, it doesn't affect the others. This matters in practice because it means the extension can flag a specific component as degraded without triggering false alarms elsewhere.
The part that's genuinely different from a basic status page is the AI log analysis. Most monitoring tools show you raw log entries. Seeing '237 errors in exception.log' tells you something is wrong. It doesn't tell you what pattern is generating those errors, whether it's been getting worse, or when it started. The AI layer interprets the log data, identifies patterns, and surfaces the specific failure. The difference is between 'there are errors' and 'PaymentGateway::processPayment is timing out on checkout for roughly 14% of requests, and it started after the October 15 extension update.'
What the dashboard monitors:
- Cron job status across all cron groups, with error counts and historical tracking
- Cache type status for FPC, block HTML, configuration, and others
- Database connection, table health, and query performance indicators
- PHP version, memory limit, OPcache, and required extension status
- Indexer status and mode (real-time vs. scheduled) with last reindex timestamp
- Module conflict detection and code integrity checks
- Filesystem health: disk space, write permissions, log directory size
- Deploy mode verification (running developer mode in production is a common oversight that degrades performance significantly)
For stores using MageDelight's Magento development services or ongoing Magento support, the dashboard also gives developers and store owners a shared reference point. Instead of a developer saying, 'I need server access to look into this,' both sides can look at the same data in the admin panel.
Monitoring Frequency: What to Check and When
Not everything needs daily attention. Here's a practical cadence built around how quickly each failure type causes visible harm.
|
Frequency |
What to Check |
Why at This Cadence |
|
Daily |
Cron errors and missed jobs; cache type status; exception log volume |
Cron failures show up in customer experience within hours. Cache problems are similar. |
|
Weekly |
Indexer states and last reindex time; PHP memory under load; database table sizes; disk growth |
These degrade slowly. A weekly check catches them before they become acute. |
|
Post-Deployment |
Module conflicts; deploy mode; cache status (frequently disabled during deploys and not re-enabled); PHP version match |
Deployments introduce most new issues. A five-minute post-deploy check finds them before customers do. |
|
Monthly |
Security patch status vs. current Adobe releases; PHP and MySQL version support check; log and session table cleanup. See Adobe's security bulletins for the current patch schedule. |
Adobe moved to monthly security patches from January 2026. Log tables accumulate silently for months before causing problems. |
When Things Break: What to Check First
Here are the first things to check when something is broken in your Magento system.
Cron Jobs Have Stopped Running
Check crontab -l as the Magento filesystem owner. If the crontab entry is missing, run php bin/magento cron:install. If the entry exists but var/log/cron.log shows no activity in the past few minutes, cron is configured, but something is preventing execution.
The most common non-obvious cause: PHP settings differ between the CLI and the web server plugin. Adobe's cron troubleshooting guide specifically flags this as a frequent root cause. On Adobe Commerce Cloud, check the cron configuration in .magento.app.yaml.
Cache Hit Rate Has Dropped
Check Varnish stats or your CDN dashboard for hit rate. If it's fallen below 80%, the first thing to look for is a block with cacheable="false" that got added to a high-traffic page layout. That attribute disables FPC for the entire URL, not just the block. One poorly attributed block can take an entire category page out of cache.
Fix: find the block, convert it to AJAX-loaded private content so the rest of the page stays cacheable. Also, check the admin cache management to confirm FPC is still enabled. It's surprisingly easy for it to get disabled and stay that way.
Indexers Stuck on 'Invalid'
Run bin/magento indexer:reindex for a forced full reindex. If they return to invalid quickly, the underlying problem is usually either a broken cron (if indexers are in scheduled mode) or an extension that invalidates indexes on every event it handles, regardless of whether anything changed.
Switching high-traffic indexers to scheduled mode under System > Tools > Index Management is generally the right call for stores with more than a few thousand SKUs. It keeps the admin panel responsive and offloads reindex work to cron.
PHP Memory Exhaustion
Symptoms: bulk imports fail partway through, reindexing exits without completing, and certain admin pages hang. Increase memory_limit in php.ini to at least 756 MB for a standard store and 2GB for complex catalogs or heavy extension loads.
Run php -i | grep memory_limit from the CLI after making the change. Note that this checks the CLI PHP configuration, not the web server PHP configuration. Both need to be updated. They're in separate ini files, and the mismatch between them is a recurring source of confusion.
Frequently Asked Questions
Here are the common questions you might have about Magento System Health Monitoring.
1. How Often Should I Run a Magento Health Check?
Daily for cron and cache. Weekly for indexers, PHP memory, and database table sizes. After every deployment or extension update, run a full check before calling the deploy done. If you're using an automated dashboard, set it to check cron and cache continuously so you're not relying on a manual schedule.
2. What's the Difference Between Server-level Monitoring and Magento Admin Monitoring?
Server-level tools (New Relic, Datadog) show you infrastructure: CPU, memory, PHP error rates, and database query times. Useful, but they require interpretation. Magento admin monitoring tells you the application-specific state: which specific cron jobs failed, which cache types are off, and which indexers are invalid. For most store owners without a DevOps team, the admin-level view provides more actionable information with less setup work.
3. Can a Non-technical Store Owner Use These Monitoring Tools?
Not the CLI ones. APM tools are even less accessible. A Magento admin dashboard extension that surfaces health data in plain status indicators is usable by anyone. You still need a developer to fix what's flagged, but knowing something is broken before your developer tells you is genuinely useful. It changes the conversation from 'customers are reporting problems' to 'I'm seeing cron errors, can we fix this today?'
4. What Magento Version is Current?
Magento 2.4.8-p4 is the current stable release as of March 2026. Adobe moved to a monthly security patch schedule starting in January 2026. Adobe's security bulletins page lists all current patches and upcoming releases. Health monitoring should include verifying your installed version against the current supported releases.
5. What Causes Most Sudden Magento Slowdowns?
In practice, three things account for the majority of unexpected performance drops: a deployment that left cache disabled, a new extension that has a cacheable="false" block on a high-traffic page, and a cron backlog that built up when no one was checking. All three are invisible without a monitoring routine. All three are easy to catch with one.
Which Monitoring Approach Fits Your Store?
The right answer depends on your team, not just your store size.
Small stores (under 10k SKUs, limited traffic)
Admin panel tools plus a weekly developer check of cron logs. At this scale, the risk window is narrow enough that manual checks work, provided they actually happen on a regular schedule.
Mid-size stores (10k to 100k SKUs, growing traffic)
A dedicated health dashboard extension is the inflection point. One day of broken cron execution, or a cache type left off overnight during a sale, has direct revenue impact. A dashboard that monitors continuously and flags problems in the admin is worth the cost many times over when something goes wrong at 2 AM before a campaign.
Enterprise stores on Adobe Commerce Cloud
Use both. New Relic handles server-level observability; a Magento-specific dashboard covers the application layer. Adobe Commerce Cloud Pro includes New Relic, so infrastructure monitoring is already in place. What's often missing is Magento-specific application visibility in a format that non-infrastructure people can actually read.
Agencies managing multiple Magento stores
CLI checks don't scale across clients. An admin dashboard extension that surfaces issues without requiring you to log into a server is the difference between proactive support and reactive firefighting. Catching a client's cron failure before they notice it is a fundamentally different support posture than getting the call after their sales rep complained.
If your current routine depends entirely on a developer remembering to check things, or on a customer reporting something wrong, that gap will close eventually, just not on your terms. The MageDelight AI Magento Health Monitor Dashboard is one way to close it intentionally. At $99 for the first year, that's less than six minutes of the $1 million median hourly retail outage that New Relic documented in 2025.
